What if there are two distinct main trends in a dynamic chart?

If there are two distinct overall trends, you can describe this in your overview.
For example:
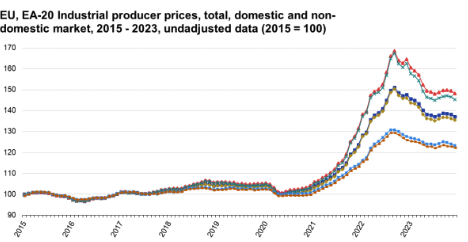
From 2015 until 2001, prices in all markets remained relatively stable, and after 2001, all increased significantly. EU domestic market and EA-20 domestic market prices increased most.
You can also just give the overall trend from beginning to end.
For example:
Prices in all markets increased over the period. EU domestic market and EA-20 domestic market prices increased most.
(Remember, never include any data in the overview. The dates in the first example are not data. The dates are used to describe the overall trend.)