How do I know what data I need to include in my details paragraphs?

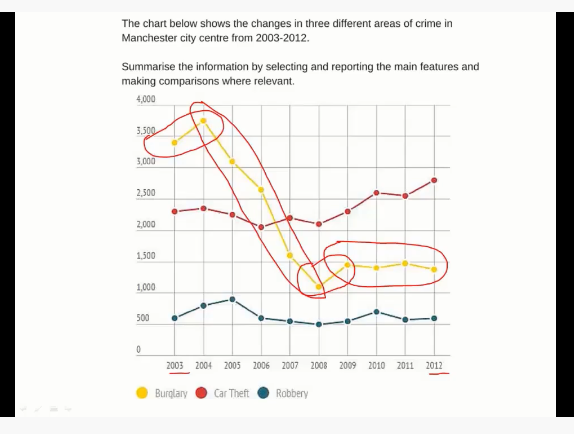
For a dynamic chart, break down the data into smaller trends. (Writing Academy Task 1 AC Module 6 / timestamp 6:29) Give the range for both axes. For example:
From 2003 to 2004, burglaries increased from about 3,400 to about 3,7000.
When comparing data (static charts), take your key features from the overview and describe them in more detail using data. (Writing Academy Task 1 AC Module 6 / timestamp 10:00)